JustTheFacts Max![]() June 29, 2022
June 29, 2022
9.1K views 0 Comments 0 Likes

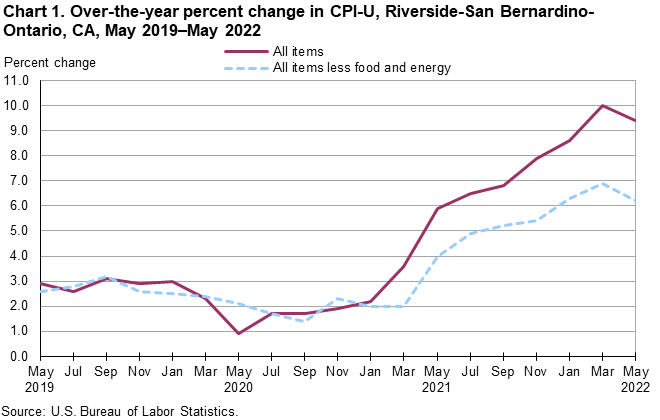
Area prices were up 1.4 percent over the past two months, up 9.4 percent from a year ago.
As measured by the Consumer Price Index for All Urban Consumers (CPI-U), Prices in the Riverside area have advanced 1.4 percent for the two months ending in May 2022, the U.S. Bureau of Labor Statistics reported today. Regional Commissioner Chris Rosenlund noted that the May increase was influenced by higher prices for shelter, gasoline, and food. (Data in this report are not seasonally adjusted. Accordingly, bi-monthly changes may reflect seasonal influences.)
Over the last 12 months, the CPI-U rose 9.4 percent. Food prices rose 9.3 percent. Energy prices jumped 35.2 percent, largely the result of an increase in the price of gasoline. The index for all items less food and energy advanced 6.2 percent over the year.
Food
Energy
All items less food and energy
Over the year, the index for all items less food and energy advanced by 6.2 percent. Components contributing to the increase included new and used motor vehicles (9.3 percent), household furnishings and operations (9.2 percent), and shelter (6.6 percent
|
Riverside-San Bernardino-Ontario, CA, CPI-U 2-month and 12-month percent changes, all items index, not seasonally adjusted |
|||||||||
|
Month |
2019 |
2020 |
2021 |
2022 |
|
||||
|
2-month |
12-month |
2-month |
12-month |
2-month |
12-month |
2-month |
12-month |
|
|
|
January |
0.4 |
3.0 |
0.5 |
3.0 |
0.9 |
2.2 |
1.5 |
8.6 |
|
|
March |
0.7 |
2.8 |
0.0 |
2.3 |
1.3 |
3.6 |
2.7 |
10.0 |
|
|
May |
1.2 |
2.9 |
-0.2 |
0.9 |
2.0 |
5.9 |
1.4 |
9.4 |
|
|
July |
-0.1 |
2.6 |
0.7 |
1.7 |
1.3 |
6.5 |
|
||
|
September |
0.6 |
3.1 |
0.5 |
1.7 |
0.8 |
6.8 |
|
||
|
November |
0.2 |
2.9 |
0.4 |
1.9 |
1.4 |
7.9 |
|
||

Desert Local News is an invitation-only, members-based publication built on fact-checked, non-biased journalism.
All articles are publicly visible and free to read, but participation is reserved for members—comments and discussion require an invitation to join.
We cover local, state, and world news with clarity and context, free from political agendas, outrage, or misinformation.
Comments